
Expression of TGR5 in adipose tissue in relation to metabolic impairment and adipose tissue dysfunction in human obesity

 , ...
, ... Abstract
Aim: Takeda G-protein-coupled receptor 5 (TGR5) is a functional receptor which mediates a variety of metabolic and immune processes and is involved in the regulation of adipocyte pathophysiology. Data on TGR5 in human adipose tissue are very limited. Therefore, the aims of this study were to investigate TGR5 expression in visceral adipose tissue (VAT) and explore its association with signs of VAT dysfunction and overt metabolic disease in individuals with obesity.
Methods: Fifty obese candidates to bariatric surgery were recruited at Sapienza University, Rome, Italy. The expression of TGR5 and markers of VAT dysfunction were assessed by rt-PCR in omental fragments obtained intraoperatively.
Results: Individuals with higher VAT TGR5 levels (high-TGR5) had greater fasting glucose (P = 0.027) and worse lipid profile (total-cholesterol, P = 0.014; LDL-cholesterol, P = 0.022) than those with lower TGR5 (low-TGR5) expression. High-TGR5 subjects showed significantly higher expression of markers of AT-specific inflammation and insulin resistance, such as tissue metallopeptidase inhibitor 1 (TIMP1; P = 0.011), poly[ADP-ribose]polymerase 1 (PARP1, P = 0.034), and WNT1-inducible-signaling pathway protein 1 (WISP1, P = 0.05), apoptosis (caspase 7, P = 0.031), and lipid trafficking (ANGPTL4, P < 0.001), compared to low-TGR5 patients. High VAT TGR5 expression predicted the presence of abnormal glucose metabolism with AUROC = 0.925 (95%CI: 0.827-1.00, P = 0.001) for the age-, sex-, and waist circumference-adjusted ROC curve.
Conclusion: Our data show that increased VAT TGR5 is associated with VAT dysfunction and impaired lipid trafficking and predicts the presence of metabolic disorders in human obesity, overall adding novel insights to the understanding of TGR5-mediated pathways in the clinical setting.
Keywords
INTRODUCTION
Takeda G-protein-coupled receptor 5 (TGR5) is a functional receptor for several hydrophobic endogenous ligands, including bile acids (BAs) and neurosteroids, such as estradiol, pregnanediol, and allopregnanolone. TGR5 is mainly expressed in gut epithelial cells and organs centrally involved in metabolism, such as the liver and the adipose tissue (AT)[1]. The activation of TGR5 is involved in immune regulation processes, mainly antagonizing the nuclear factor kB signaling[2], regulates lipid metabolism[3], and promotes glucagon-like peptide-1 release in mice, thus taking part in the glucose-insulin homeostasis[4]. For the overall favorable effects on metabolism, TGR5 agonists have been recently tested as novel pharmaceutical approaches for dysmetabolic conditions such as non-alcoholic fatty liver disease[5-7]. Moreover, the BA-induced TGR5 signaling has recently been acknowledged for its involvement in beige remodeling of white AT (WAT)[8], thus providing a potential link between BA signaling and fundamental cellular processes in adipocytes. Experimental models showed that BA administration augments energy expenditure in mice through a pathway mediated by TGR5 and its effects on the thyroid hormone activating enzyme iodothyronine deiodinase type II in brown adipose tissue[9].
TGR5 expression is detectable in all stages of adipocyte differentiation[8,10] and is not affected by experimentally induced inflammatory stress in animal models[10], suggesting that TGR5 may represent an unregulated gene in adipocytes under basal conditions.
Data from experimental models demonstrate that TGR5 is a central player in AT metabolism and the regulation of local immune processes. In turn, AT dysfunction, as indicated by the presence of local inflammation and impaired lipid metabolism, is a recognized determinant of metabolic diseases in condition of weight excess[11-14]. While initial evidence points towards a major role of TGR5 in regulating energy balance and AT homeostasis under physiological conditions, little is known about TGR5 in obesity and insulin resistance associated disorders[15]; moreover, no evidence is currently available on TGR5 expression in visceral AT (VAT) in humans.
Therefore, the aims of this study were to investigate TGR5 expression in human VAT and explore its association with signs of adipose tissue dysfunction and metabolic impairment in presence of obesity.
METHODS
Study population
For this cross-sectional study, we recruited fifty consecutive individuals with severe obesity referring to our outpatient clinics at Sapienza University of Rome, Italy, to undergo bariatric surgery as for clinical indication. Eligible for this study were all subjects aged between 20 and 65 years able to provide informed consent to the study participation; specific inclusion and exclusion criteria reflected those for sleeve gastrectomy intervention[16].
All study participants underwent medical history collection, clinical work-up, and fasting blood sampling for routine clinical evaluation and metabolic profiling. Weight and height were measured in light clothes and without shoes to calculate the body mass index (BMI, kg/m2). Waist circumference (cm) was measured midway between the 12th rib and the iliac crest. Systemic systolic and diastolic blood pressure (SBP and DBP, mmHg) were measured after 5 min rest, and the average value between two measures was considered for the analyses. Presence of abnormal glucose metabolism, in terms of impaired glucose regulation[IGR: impaired fasting glucose (IFG) and impaired glucose tolerance (IGT)] or type 2 diabetes mellitus (T2DM) was defined according to the American Diabetes Association 2020 criteria[17]; metabolic syndrome was diagnosed based on the NCEP-ATP III definition[18].
Laboratory tests
Twelve-hour fasting blood samples were drawn from the anterior-cubital vein for measuring blood glucose (FBG, mg/dL), glycosylated hemoglobin (HbA1c, mmoL/moL, %), fasting serum insulin (FSI, IU/mL), total cholesterol (mg/dL), high-density lipoprotein cholesterol (HDL, mg/dL), triglycerides (mg/dL), aspartate aminotransferase (AST, IU/L), alanine aminotransferase (ALT, IU/L), gamma-glutamyl transpeptidase (GGT, mg/dL), and creatinine (mg/dL) by centralized standard methods. Low-density lipoprotein (LDL) cholesterol value was obtained using the Friedewald formula.
VAT collection and gene expression analyses
Omental fragments of about 1 cm3 of volume were obtained from all study participants to measure VAT TGR5 mRNA expression levels and evaluate the presence of tissue markers of VAT inflammation and dysfunction.
In particular, we measured VAT mRNA levels of pro-inflammatory molecules mostly implicated in processes associated with impaired VAT lipid metabolism, starting from the gene expression array panels investigated in relation to VAT angiopoietin-like protein 4 (ANGPTL4) and lipoprotein lipase expression in our previous report[14]. Therefore, we measured the local expression of genes implicated in: adipose tissue-specific inflammation/dysfunction and insulin resistance, such as the metallopeptidase inhibitor 1 (TIMP1)[19], the poly[ADP-ribose] polymerase 1 (PARP1)[20], and WNT1-inducible-signaling pathway protein 1 (WISP1)[13]; apoptosis, such as caspase 7[21]; and lipid trafficking, such as the ANGPTL4 mRNA expression levels[14,22]. The expression of the other main bile acid receptor, the farnesoid-X receptor (FXR)[23], was also measured in VAT samples from all study participants.
All analyses were performed by two experienced pathologists, who were blinded per protocol to participants’ identity. Experimental procedures for gene expression analyses followed those described in our previous report[24]. Briefly, total RNA from Formalin-fixed paraffin-embedded (FFPE) tissue was extracted by using RecoverAllTM Total Nucleic Acid Isolation Kit for FFPE (ThermoFisher Scientific, Waltham, MA, USA) according to the supplier’s instructions. We confirmed the purity and quantity of RNA by NanoDrop ND-1000 Spectrophotometer (Thermo Fisher Scientific Inc., Waltham, MA). Then, total RNA was reverse transcribed into cDNA using the High Capacity cDNA Reverse Transcription Kit (Applied Biosystems, Foster City, CA, USA).
The PCR products of human caveolin 1 (CAV1), CASP7, PARP1, WISP1, TGR5, ANGPTL4, and FXR were detected by using gene specific primers and probes labeled with reporter dye fluorescein amidite (FAM) (genes ID: 857, 840, 142, 8840, 151306, 51129, and 9971, respectively).
Glyceraldehyde 3-phosphate dehydrogenase (GAPDH) was used as an internal standard, which yielded a predicted amplicon of 58 bp. GAPDH was detected using gene-specific primers and probes labeled with reporter day FAM (gene ID: 2597). TaqMan real-time quantitative PCR was performed on an ABI PRISM 7500 Fast Real-Time PCR System (Applied Biosystem, Foster City, CA, USA). PCR reactions were carried out on 96-well plates with 10 uL per well using 1 TaqMan Master Mix, and the results were evaluated at the end of the reaction using ABI PRISM 7500 software (Applied Biosystem, Foster City, CA, USA). The amplification product lengths of these assays were 66, 76, 111, 84, 159, 67, and 78 base pairs, respectively. The experiment was repeated in triplicate for each assay, and the Ct values for each set of three reactions were averaged for all subsequent calculations. The 2-ΔCt method was used to calculate relative changes in gene expression.
Statistics
To the best of our knowledge, no study has investigated thus far the omental TGR5 expression in relation to VAT inflammation and metabolic abnormalities in humans. Therefore, the statistical power of this study was confirmed by a post hoc sample size calculation considering the mean difference of TIMP-1 expression levels between subjects in Terile I vs. Tertile III for TGR5 expression; thus, we obtained that four patients per group would be enough to reach statistical significance with power = 90% and α error = 0.01.
All statistic procedures were performed using SPSS package version 25. Values are shown as mean ± SD or percentage, as appropriate. Mean values between two independent groups (Tertile I vs. Tertile III of TGR5 expression levels) were compared by Mann-Whitney test for continuous variables and χ2 test for categorical parameters; comparisons between more than two subgroups (i.e., among tertiles of VAT TGR5 distribution) were performed by Kruskal-Wallis test. Bivariate correlations were explored by Spearman’s r coefficients. To test the independence of the association between TGR5 expression and impaired glucose metabolism, as considered as a binary trait (absence/presence, dependent variable), we built a multivariable logistic regression model including age, sex, TGR5 mRNA expression levels, and potential clinical confounders. Finally, a receiving operator curve (ROC), adjusted for age and sex, was calculated to explore the area under the curve of high VAT TGR5 levels for predicting the presence of abnormal glucose metabolism in our study participants. A two-tailed P value < 0.05 was considered statistically significant, with a 95% confidence interval.
Ethics
The study protocol was reviewed and approved by the Ethics Committee of Policlinico Umberto I (approval number 3550, 26 February 2015) and conducted in conformance with the Helsinki Declaration. Informed written consent was obtained from the participants before all the study procedures.
RESULTS
All study participants had detectable TGR5 mRNA expression levels at the omental biopsy. The study population was divided into three subgroups in relation to the levels of TGR5 expression detected in VAT samples. Characteristics of study participants in relation to TGR5 levels are summarized in Table 1; TGR5 mRNA expression levels according to the tertile of distribution are shown in Figure 1.
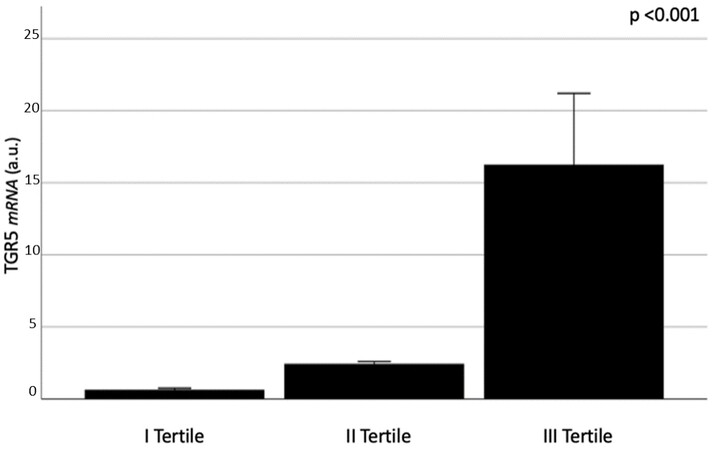
Figure 1. VAT TGR5 mRNA expression in relation to the tertiles of distribution. Kruskal-Wallis test applied. Data are shown as mean value ± standard error and expressed as arbitrary units (a.u.).
Characteristics of the study population in relation to the TGR5 mRNA expression levels in the VAT (Tertiles I, II, and III)
| Tertile I | Tertile II | Tertile III | P-value | |
| TGR5 mRNA (A.U.) | 0.64 ± 0.39 | 2.44 ± 0.67 | 16.25 ± 19.82 | < 0.001 |
| Median (95%CI) | 0.70 (0.43-0.85) | 2.45 (2.1-2.8) | 10.9 (5.7-26.8) | |
| Age (years) | 46.8 ± 10.5 | 41.5 ± 9.3 | 56.6 ± 10.7 | 0.27 |
| Gender (M/F) | 5/11 | 3/14 | 5/12 | 0.62§ |
| BMI (kg/m2) | 42.8 ± 4.5 | 41.5 ± 5.6 | 42.6 ± 3.9 | 0.59 |
| Waist circumference (cm) | 126.1 ± 12.2 | 123.6 ± 14.4 | 128.2 ± 16.6 | 0.71 |
| SBP (mmHg) | 132.8 ± 17.6 | 129.1 ± 11.5 | 132.3 ± 6.6 | 0.65 |
| DBP (mmHg) | 84 ± 9.5 | 83.2 ± 8.3 | 83 ± 7.7 | 0.92 |
| Total cholesterol (mg/dL) | 176.8 ± 33.4 | 186.8 ± 33.9 | 206 ± 27.5 | 0.046, 0.014* |
| HDL-C (mg/dL) | 48.6 ± 10.7 | 46.1 ± 14.7 | 45.7 ± 8.5 | 0.63 |
| LDL-C (mg/dL) | 104.3 ± 28.6 | 105.8 ± 37 | 131.2 ± 30.2 | 0.06, 0.022* |
| Triglycerides (mg/dL) | 120.9 ± 27.4 | 175.4 ± 97.8 | 146.3 ± 61 | 0.14, 0.05* |
| FBG (mg/dL) | 93.5 ± 18.8 | 101.7 ± 34.2 | 105.2 ± 23.8 | 0.05, 0.027* |
| HbA1c - mmoL/moL HbA1c - % | 35.6 ± 4.4 5.4 ± 0.4 | 40.5 ± 11.9 5.8 ± 1 | 38.4 ± 7.8 5.7 ± 0.7 | 0.35 |
| AST (IU/l) | 26.5 ± 6.7 | 33.4 ± 21.9 | 31.5 ± 15 | 0.94 |
| ALT (IU/l) | 26.9 ± 9 | 37.6 ± 16 | 50.3 ± 33.7 | 0.18, 0.05* |
| GGT (IU/l) | 32.7 ± 17.2 | 34.9 ± 24.5 | 26.9 ± 19.6 | 0.18 |
| Total bilirubin (mg/dL) | 0.66 ± 0.3 | 0.76 ± 0.5 | 0.71 ± 0.1 | 0.13 |
| Conjugated bilirubin (mg/dL) | 0.17 ± 0.07 | 0.18 ± 0.09 | 0.17 ± 0.08 | 0.99 |
| Serum creatinine (mg/dL) | 0.79 ± 0.1 | 0.72 ± 0.1 | 0.71 ± 0.1 | 0.23 |
| IGR-T2DM (no/yes) | ||||
| # no/yes % prevalence | 13/2 13% | 14/4 18% | 11/6 42% | 0.06§ |
| MS | ||||
| # no/yes % prevalence | 11/5 31% | 9/8 47% | 7/10 59% | 0.28§ |
TGR5 expression and VAT homeostasis
Individuals with increased VAT TGR5 expression, specifically those belonging to the highest tertile of TGR5 mRNA levels, had signs of inflammation and dysfunction at the VAT biopsy. In particular, in these patients, we found greater VAT expression of TIMP1 (P = 0.011), caspase 7 (P = 0.031), PARP1 (P = 0.034), and WISP1 (P = 0.05) mRNA levels and significantly higher VAT ANGPTL4 levels than in subjects within the lowest tertile for VAT TGR5 (P < 0.001; Mann-Whitney comparison tests, Figure 2). In general, VAT TIMP1, caspase 7, PARP1, WISP1, and ANGPTL4 increased throughout tertiles of higher TGR5 expression (Figure 2, Kruskal-Wallis test applied).
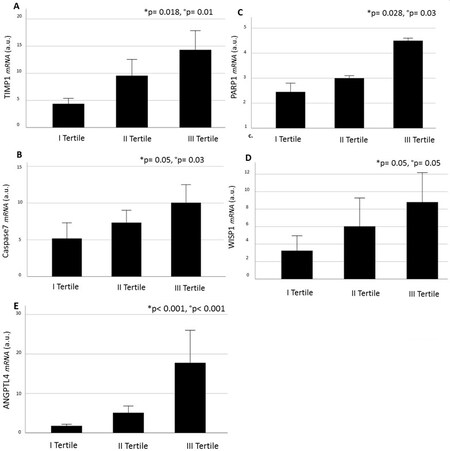
Figure 2. VAT TIMP1 (A); caspase 7 (B); PARP1 (C); WISP1 (D); and ANGTPL4 (E) mRNA expression in relation to the tertiles of VAT TGR5 expression. *Multiple comparisons Kruskal-Wallis test applied; Mann-Whitney test between Tertiles I and III applied. Data are shown as mean value ± standard error and expressed as arbitrary units (a.u.). TIMP-1: TIMP metallopeptidase inhibitor 1; PARP1: poly[ADP-ribose] polymerase 1; WISP1: WNT1-inducible-signaling pathway protein 1; ANGPTL4: angiopoietin-like 4.
In the bivariate analysis, increased TGR5 mRNA levels, considered as a continuous variable, positively correlated with FBG, total and LDL cholesterol concentrations, and TIMP1, caspase 7, PARP1, and ANGPTL4 mRNA expression in VAT, overall describing a phenotype with more pronounced metabolic impairment within individuals with morbid obesity [Table 2]. FSI levels were available from 32 out of 50 study participants and positively correlated with triglycerides levels (r = 0.43, P = 0.027) and, slightly, with age (r = 0.34, P = 0.065). No significant correlation was found between FSI and other metabolic variables, including fasting blood glucose, diabetes, and TGR5 expression.
VAT TGR5 mRNA expression: bivariate correlation analysis (Spearman’s coefficient)
| Correlation coefficient | P value | |
| Age | -0.07 | 0.60 |
| BMI | -0.01 | 0.94 |
| Waist circumference | 0.02 | 0.88 |
| FBG | 0.33 | 0.02 |
| HbA1c | 0.14 | 0.39 |
| FSI | 0.16 | 0.61 |
| Total cholesterol | 0.44 | 0.004 |
| HDL | -0.10 | 0.60 |
| LDL | 0.37 | 0.018 |
| Triglycerides | 0.12 | 0.44 |
| AST | 0.05 | 0.74 |
| ALT | 0.18 | 0.21 |
| GGT | -0.22 | 0.13 |
| MIP1α | -0.02 | 0.87 |
| MIP2 | -0.24 | 0.09 |
| CAV1 | 0.10 | 0.51 |
| TIMP1 | 0.33 | 0.021 |
| Caspase7 | 0.33 | 0.018 |
| PARP1 | 0.38 | 0.006 |
| ANGPTL4 | 0.48 | < 0.001 |
Together with TGR5, FXR represents another important BA receptor functionally involved in adipocyte homeostasis and metabolic regulation, as demonstrated in experimental studies[10]. Indeed, we also evaluated FXR mRNA expression in VAT samples; however, we did not find detectable FXR levels in any of our study participants.
VAT TGR5 expression and clinical outcomes
Obese individuals belonging to the highest tertile of TGR5 mRNA expression had worse lipid and glucose profile, as expressed by higher total cholesterol, LDL, and FBG, in comparison to subjects with lower TGR5 in the VAT [Table 1]. Moreover, individuals in Tertile III of the TGR5 distribution had higher mean ALT levels than those in Tertile I of TGR5 (P = 0.05). The results are shown in Table 1.
No difference in age, sex distribution, and body adiposity, the latter evaluated by BMI and waist circumference, was observed between the subgroups.
Twelve out of fifty patients (24% of study participants) had abnormal glucose metabolism, as indicated by either T2DM (n = 6/50) or IGR (IFG, n= 6/50; one of them had IFG + IGT). Greater TGR5 mRNA expression in VAT was independently associated with the presence of abnormal glucose metabolism regardless of sex, age, or waist circumference in the multivariable linear regression analysis (P = 0.029; Standardized β Coefficient, 0.37; Table 3).
Multivariable linear regression analysis. VAT TGR5 expression is the dependent variable
| β coefficient | Standard error | Standardized β coefficient | P-value | |
| Age Sex Waist circumference AGM (no/yes) | 0.665 | 0.008 | -0.309 | 0.048 |
| 0.282 | 0.189 | 0.234 | 0.143 | |
| 0.001 | 0.006 | 0.023 | 0.156 | |
| 0.459 | 0.203 | 0.370 | 0.029 |
High VAT TGR5 expression (Tertile III vs. Tertile I of TGR5 levels) was able to predict the presence of abnormal glucose metabolism in obese individuals with AUROC = 0.925 (95%CI: 0.827-1.00; P = 0.001) for the age-, sex-, and waist circumference-adjusted ROC curve [Figure 3].
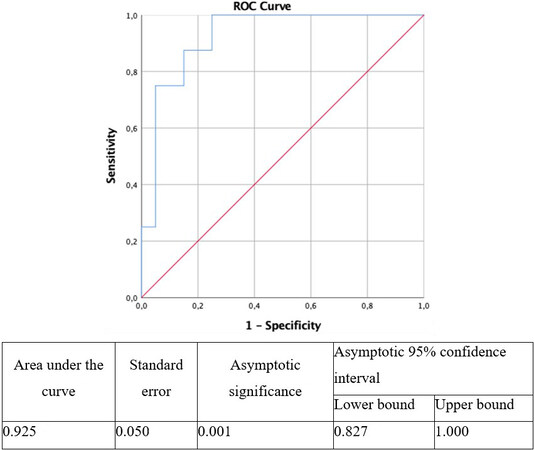
Figure 3. VAT TGR5 receiver operating characteristic (ROC) curve for presence of abnormal glucose metabolism (AGM) corrected for age and sex.
Lastly, we explored metabolic correlates of VAT TGR5 expression only in participants with normal glucose metabolism (n = 38) and found that VAT TGR5 expression positively correlated with total cholesterol (r = 0.42, P = 0.016); a trend toward positive association was also observed between TGR5 and FBG (r = 0.30, P = 0.06) in individuals with optimal fasting glycemia (mean ± SD FBG: 89.4 ± 5.2 mg/dL).
DISCUSSION
The main finding of this study is the demonstration that elevated TGR5 levels in VAT are associated with adipose tissue dysfunction as well as the presence of metabolic alterations, such as abnormal glucose metabolism and impaired lipid profile, in obese individuals. Greater TGR5 levels tightly correlate with the presence of signs of VAT inflammation and altered lipid metabolism. To our knowledge, this is the first study investigating TGR5 expression in human VAT in relation to clinical metabolic impairment and signs of local inflammation and dysfunction in the adipose tissue.
The presence of TGR5 expression in adipocytes has been shown previously in experimental models during all phases of cell maturation[8,10]; indeed, TGR5 activation mediates pathways that elicit beige remodeling in the white adipose tissue and modulates mitochondrial function in mice[8].
In isolated adipocytes, TGR5 promotes mitochondrial biogenesis and β-oxidation by increasing lipolysis and substrate availability[8]; thus, TGR5 appears as a protein involved in the overall regulation of energy balance. The capability of TGR5 signaling to increase the energetic expenditure is preserved in the condition of chronic caloric overload, as this axis was shown to induce the expression of beiging markers in WAT from mice chronically fed with a high-fat diet[8].
In our study, we demonstrated increased VAT TGR5 expression levels in obese individuals with metabolic abnormalities; however, no specific association was observed with total body mass or fat distribution. Instead, we found a strong correlation between VAT TGR5 levels and signs of impaired adipocyte energy balance, as indicated by increased expression of PARP1[20] and TIMP1[19], and pro-apoptotic state, as expressed by higher caspase 7 levels[21]. Hence, these overall findings may be interpreted as a tentative of compensatory energetic boost when metabolic disease develops in obesity.
According to our results, the only previous study investigating TGR5 expression in human AT found increased TGR5 in subcutaneous adipose tissue from obese individuals compared to non-obese controls[15]. TGR5 expression levels correlated with the presence of obesity as well as the resting metabolic rate and were restored after diet, in the phase preceding the maximal weight loss, suggesting that TGR5 expression in subcutaneous adipose tissue may be regulated by changes in energy intake or metabolic rate rather than fat mass itself[15].
In our study, we demonstrated the occurrence of a parallel increase of TGR5 and ANGPTL4 expression levels in metabolically unhealthy obese individuals. Both ANGPTL4 and TGR5 are involved in processes favoring beiging remodeling, thermogenesis, increased energy expenditure, and glucose tolerance by converging on the PKA-p38MAPK pathway[8,22,25]. However, the selective knock-out of the ANGPTL4 gene in adipose tissue was shown to reduce systemic inflammation and improve atherosclerosis and glucose tolerance in obese mice, without reducing VAT inflammation[26]. Recently, we reported that ANGPTL4 overexpression in human VAT is associated with signs of AT inflammation and adipocyte size heterogeneity, which is a marker of lipid metabolic impairment and dysfunction, and predicts the presence of abnormal glucose metabolism in obese individuals[14].
This is the first report on TGR5 mRNA levels in VAT from obese individuals in the clinical setting. Although the study design does not allow ascertaining the mechanistic pathways behind our findings, we could speculate that, in the condition of caloric overload, local stressors, i.e., impaired energy balance, inflammation, and pro-apoptotic state, may induce the over-expression of metabolic regulators such as TGR5 and ANGPTL4, to contrast further fat mass expansion and tissue dysfunction. Indeed, changes in VAT microenvironment towards a pro-inflammatory pattern, which is often detected in the presence of obesity and is clinically associated with unfavorable risk profile[27-29], may represent the starting signal for local TGR5 compensatory activation aiming at restoring VAT homeostasis.
Another result from our study is the absence of expression of FXR in the VAT from obese individuals, so raising a question on the involvement of this receptor in the adipocyte metabolism in humans. FXR was shown to play a key role in determining adipocyte size and AT architecture in experimental models[23] and reduced FXR expression has been observed in obese vs. lean mice[30]; however, at the bulk of our knowledge, no data were available so far on FXR expression in human adipose tissue. Besides, since our population did not involve metabolically healthy lean individuals, we cannot exclude that the results obtained in this study are specific for obese individuals, with or without metabolic abnormalities. Further studies are warranted to explore VAT FXR expression in different metabolic phenotypes. Moreover, although the lab protocol applied for RNA extraction optimally performed for the other genes tested in this and previous studies from our group[14,24], a role of the methods used in explaining the results on VAT FXR expression cannot be conclusively ruled out.
This study has some limitations. First, the cross-sectional design of this investigation does not allow drawing functional or mechanistic conclusions on the study findings. Moreover, data on VAT TGR5 expression in non-obese healthy individuals would have revealed the relative gene expression under basal conditions. However, obtaining omental fragments from healthy individuals may expose to ethical concerns, since VAT biopsies can only be taken during surgery, which needs clinical reasons to be performed; this, by definition, excluded potential healthy donors to be recruited for this investigation. Moreover, data on TGR5 protein expression in the VAT were not available; therefore, the possibility that TGR5 gene expression may not represent increased function of the encoded protein cannot be ruled out. Similarly, data on tissue levels of TGR5 target genes could provide insights on TGR5 activity beside the expression per se. Indeed, experimental evidence shows that adipocyte TGR5 expression is not affected by inflammatory stressors[10], suggesting that TGR5 activation - rather than TGR5 expression - may have a major influence on metabolism in humans. Future studies addressing these issues may add interesting tips to this topic.
In conclusion, this study demonstrates that TGR5 expression is largely detectable in omental fat from obese individuals, is associated with impaired VAT homeostasis and ANGPTL4, and predicts metabolic disease in obesity, overall adding novel insights to the understanding of TGR5-mediated pathways in the clinical setting.
DECLARATIONS
Authors’ contributionsConceptualization: Barchetta I, Cavallo MG, Baroni MG, Lenzi A
Methodology: Chiappetta C, Di Cristofano C, Silecchia G
Performed statistical analysis: Barchetta I, Baroni MG
Dataset preparation: Chiappetta C, Di Biasio A, Dule S, Cimini FA
Data curation: Dule S, Cimini FA, Bertoccini L, Di Biasio A, Capoccia D, Leonetti F
Writing - original draft preparation: Barchetta I, Chiappetta C, Cimini FA
Writing - review and editing: Cavallo MG, Baroni MG, Di Cristofano C
Supervision: Cavallo MG, Barchetta I, Lenzi A, Leonetti F
Funding acquisition: Barchetta I, Cavallo MG
Availability of data and materialsAll authors agree to share data upon request.
Financial support and sponsorshipThis research was funded by grants from Sapienza University “Ateneo Research” to Cavallo MG; Barchetta I was supported by a fellowship from “Fondazione Eli Lilly”.
Conflicts of interestAll authors declared that there are no conflicts of interest.
Ethical approval and consent to participateThe study was conducted according to the guidelines of the Declaration of Helsinki, and approved by Ethics Committee of Policlinico Umberto I (approval number 3550, 26 February 2015). Informed consent was obtained from all subjects involved in the study.
Consent for publicationNot applicable.
Copyright© The Author(s) 2021.
REFERENCES
1. Gertzen CGW, Gohlke H, Häussinger D, et al. The many facets of bile acids in the physiology and pathophysiology of the human liver. Biol Chem 2021;402:1047-62.
2. Guo C, Qi H, Yu Y, et al. The G-protein-coupled bile acid receptor gpbar1 (tgr5) inhibits gastric inflammation through antagonizing NF-κB signaling pathway. Front Pharmacol 2015;6:287.
3. Pols TW, Noriega LG, Nomura M, Auwerx J, Schoonjans K. The bile acid membrane receptor TGR5 as an emerging target in metabolism and inflammation. J Hepatol 2011;54:126-372.
4. Thomas C, Gioiello A, Noriega L, et al. TGR5-mediated bile acid sensing controls glucose homeostasis. Cell Metab 2009;10:167-77.
5. Jadhav K, Xu Y, Xu Y, et al. Reversal of metabolic disorders by pharmacological activation of bile acid receptors TGR5 and FXR. Mol Metab 2018;9:131-40.
6. Wang XX, Wang D, Luo Y, et al. FXR/TGR5 dual agonist prevents progression of nephropathy in diabetes and obesity. J Am Soc Nephrol 2018;29:118-37.
7. Brønden A, Knop FK. Gluco-metabolic effects of pharmacotherapy-induced modulation of bile acid physiology. J Clin Endocrinol Metab 2020;105:362-73.
8. Velazquez-Villegas LA, Perino A, Lemos V, et al. TGR5 signalling promotes mitochondrial fission and beige remodelling of white adipose tissue. Nat Commun 2018;9:245.
9. Watanabe M, Houten SM, Mataki C, et al. Bile acids induce energy expenditure by promoting intracellular thyroid hormone activation. Nature 2006;439:484-9.
10. Schmid A, Schlegel J, Thomalla M, Karrasch T, Schäffler A. Evidence of functional bile acid signaling pathways in adipocytes. Mol Cell Endocrinol 2019;483:1-10.
11. Cimini FA, Barchetta I, Ciccarelli G, et al. Adipose tissue remodelling in obese subjects is a determinant of presence and severity of fatty liver disease. Diabetes Metab Res Rev 2021;37:e3358.
12. Barchetta I, Angelico F, Del Ben M, et al. Phenotypical heterogeneity linked to adipose tissue dysfunction in patients with Type 2 diabetes. Clin Sci (Lond) 2016;130:1753-62.
13. Barchetta I, Cimini FA, Capoccia D, et al. WISP1 is a marker of systemic and adipose tissue inflammation in dysmetabolic subjects with or without type 2 diabetes. J Endocr Soc 2017;1:660-70.
14. Barchetta I, Chiappetta C, Ceccarelli V, et al. Angiopoietin-like protein 4 overexpression in visceral adipose tissue from obese subjects with impaired glucose metabolism and relationship with lipoprotein lipase. Int J Mol Sci 2020;21:7197.
15. Svensson PA, Olsson M, Andersson-Assarsson JC, et al. The TGR5 gene is expressed in human subcutaneous adipose tissue and is associated with obesity, weight loss and resting metabolic rate. Biochem Biophys Res Commun 2013;433:563-6.
16. Bhandari M, Fobi MAL, Buchwald JN. Bariatric Metabolic Surgery Standardization (BMSS) Working Group. Standardization of bariatric metabolic procedures: world consensus meeting statement. Obes Surg 2019;29:309-45.
17. Diabetes Association. 1. Improving care and promoting health in populations: standards of medical care in diabetes-2020. Diabetes Care 2020;43:S7-S13.
18. Grundy SM, Cleeman JI, Daniels SR, et al. American Heart Association, National Heart, Lung, and Blood Institute. Diagnosis and management of the metabolic syndrome: an American Heart Association/National Heart, Lung, and Blood Institute Scientific Statement. Circulation 2005;112:2735-52.
19. Meissburger B, Stachorski L, Röder E, Rudofsky G, Wolfrum C. Tissue inhibitor of matrix metalloproteinase 1 (TIMP1) controls adipogenesis in obesity in mice and in humans. Diabetologia 2011;54:1468-79.
20. Szántó M, Bai P. The role of ADP-ribose metabolism in metabolic regulation, adipose tissue differentiation, and metabolism. Genes Dev 2020;34:321-40.
21. Tinahones FJ, Coín Aragüez L, Murri M, et al. Caspase induction and BCL2 inhibition in human adipose tissue: a potential relationship with insulin signaling alteration. Diabetes Care 2013;36:513-21.
22. McQueen AE, Kanamaluru D, Yan K, et al. The C-terminal fibrinogen-like domain of angiopoietin-like 4 stimulates adipose tissue lipolysis and promotes energy expenditure. J Biol Chem 2017;292:16122-34.
23. van Zutphen T, Stroeve JHM, Yang J, et al. FXR overexpression alters adipose tissue architecture in mice and limits its storage capacity leading to metabolic derangements. J Lipid Res 2019;60:1547-61.
24. Barchetta I, Cimini FA, Capoccia D, et al. Neurotensin is a lipid-induced gastrointestinal peptide associated with visceral adipose tissue inflammation in obesity. Nutrients 2018;10:526.
25. McQueen AE, Koliwad SK, Wang JC. Fighting obesity by targeting factors regulating beige adipocytes. Curr Opin Clin Nutr Metab Care 2018;21:437-43.
26. Aryal B, Singh AK, Zhang X, et al. Absence of ANGPTL4 in adipose tissue improves glucose tolerance and attenuates atherogenesis. JCI Insight 2018;3:97918.
27. Wensveen FM, Valentić S, Šestan M, Turk Wensveen T, Polić B. The "Big Bang" in obese fat: events initiating obesity-induced adipose tissue inflammation. Eur J Immunol 2015;45:2446-56.
28. Verboven K, Wouters K, Gaens K, et al. Abdominal subcutaneous and visceral adipocyte size, lipolysis and inflammation relate to insulin resistance in male obese humans. Sci Rep 2018;8:4677.
29. Barchetta I, Cimini FA, Ciccarelli G, Baroni MG, Cavallo MG. Sick fat: the good and the bad of old and new circulating markers of adipose tissue inflammation. J Endocrinol Invest 2019;42:1257-72.
Cite This Article
Export citation file: BibTeX | RIS
OAE Style
Barchetta I, Chiappetta C, Di Biasio A, Cimini FA, Bertoccini L, Dule S, Capoccia D, Di Cristofano C, Silecchia G, Leonetti F, Baroni MG, Lenzi A, Cavallo MG. Expression of TGR5 in adipose tissue in relation to metabolic impairment and adipose tissue dysfunction in human obesity. Metab Target Organ Damage 2021;1:8. http://dx.doi.org/10.20517/mtod.2021.04
AMA Style
Barchetta I, Chiappetta C, Di Biasio A, Cimini FA, Bertoccini L, Dule S, Capoccia D, Di Cristofano C, Silecchia G, Leonetti F, Baroni MG, Lenzi A, Cavallo MG. Expression of TGR5 in adipose tissue in relation to metabolic impairment and adipose tissue dysfunction in human obesity. Metabolism and Target Organ Damage. 2021; 1(1): 8. http://dx.doi.org/10.20517/mtod.2021.04
Chicago/Turabian Style
Barchetta, Ilaria, Caterina Chiappetta, Alberto Di Biasio, Flavia Agata Cimini, Laura Bertoccini, Sara Dule, Danila Capoccia, Claudio Di Cristofano, Gianfranco Silecchia, Frida Leonetti, Marco Giorgio Baroni, Andrea Lenzi, Maria Gisella Cavallo. 2021. "Expression of TGR5 in adipose tissue in relation to metabolic impairment and adipose tissue dysfunction in human obesity" Metabolism and Target Organ Damage. 1, no.1: 8. http://dx.doi.org/10.20517/mtod.2021.04
ACS Style
Barchetta, I.; Chiappetta C.; Di Biasio A.; Cimini FA.; Bertoccini L.; Dule S.; Capoccia D.; Di Cristofano C.; Silecchia G.; Leonetti F.; Baroni MG.; Lenzi A.; Cavallo MG. Expression of TGR5 in adipose tissue in relation to metabolic impairment and adipose tissue dysfunction in human obesity. Metab Target Organ Damage. 2021, 1, 8. http://dx.doi.org/10.20517/mtod.2021.04
About This Article
Copyright

Data & Comments
Data


 Cite This Article 14 clicks

 Like This Article 27
likes
Like This Article 27
likes


Comments
Comments must be written in English. Spam, offensive content, impersonation, and private information will not be permitted. If any comment is reported and identified as inappropriate content by OAE staff, the comment will be removed without notice. If you have any queries or need any help, please contact us at support@oaepublish.com.