
Social network analysis: the use of graph distances to compare artificial and criminal networks

 , ...
, ... Abstract
Aim: Italian criminal groups become more and more dangerous spreading their activities into new sectors. A criminal group is made up of networks of hundreds of family gangs which extended their influence across the world, raking in billions from drug trafficking, extortion and money laundering. We focus in particular on the analysis of the social structure of two Sicilian crime families and we used a Social Network Analysis approach to study the social phenomena. Starting from a real criminal network extracted from meetings emerging from the police physical surveillance during 2000s, we here aim to create artificial models that present similar properties.
Methods: We use specific tools of social network analysis and graph theory such as network models (i.e., random, small-world and scale-free) and graph distances to quantify the similarity between an artificial network and a real one. To the best of our knowledge, spectral graph distances and the DeltaCon similarity have never been applied to criminal networks.
Results: Our experiments identify the Barabási-Albert model as the one which better represents a criminal network. For this reason, we could expect that new members of a criminal organization will be more likely to establish connections with high degree nodes rather than low degree nodes.
Conclusion: Artificial but realistic models can represent a useful tool for Law Enforcement Agencies to simulate and study the structure, evolution and faults of criminal networks.
Keywords
1. Introduction
A structured group of people that operate to pursue their own illicit advantages is defined as a criminal organization. Their goals is to operate covertly to obtain goods and services in public demand in an illicit manner. In addition, those achievements come at the cost of other individuals, groups or societies[1]. One of the most well-known criminal organizations (i.e., gangs[2]crews[3]firms[4]syndacates[4]) is located in Sicily[5] and it was matter of study by Gambetta[6]. More recently, Letizia Paoli[7] produced a clinically accurate scenario behavior, motivations, and structure of the same criminal organization in Italy. Such a precious outcome has been obtained thanks to previously undisclosed confessions of former crime members now cooperating with the police.
It should be pinpointed that organized crime is based relational traits. This is why a Social Network Analysis (SNA) perspective is needed to deal with those kind of groups[8]. The work on Sicilian crime syndicates social structure, more specifically, achieved such a huge interest by the scientific community[9].
Thus, SNA became a powerful analytical tool that allows to investigate on criminal organizations and to gain a deeper understanding of criminal behavior[10]. Indeed, the description of the structure of a criminal organization, the construction of crime prevention systems[11], or the identification of the leaders within those kind of groups[12] are all features that can be described by the use of SNA. It is exploited by Law Enforcement Agencies (LEAs) as well to assess the impact of arrests in criminal organizations and the evolution of its structure as a reaction[13], so to evaluate interventions aimed at dismantling and disrupting criminal networks[14]. Due to the difficulties in obtaining such kind of information, it is a unique opportunity to examine real datasets with the aim of using them to build mathematical objects (i.e., graphs or networks) and apply classical SNA tools on them[11,13–18].
LEAs had increasingly employed SNA to analyze the interactions among criminals based, for instance, on calls, meetings and other events obtained from investigations[18–20]. However, due to the cover nature of criminal organizations, it is impossible to collect the whole network and describe entirely both the structure and the activities of them[21]: skilled criminal can manage to avoid detection and to shield sensible information and consequently police might end up missing some surveillance targets. Another physical limit is given by missing data issues that may affects both nodes (e.g., criminals) and/or edges (e.g., interaction among criminals). This means criminal networks suffer from incompleteness, incorrectness and inconsistencies and the causes may depends on deliberate deception by criminals, limited resources and/or unintentional errors by LEA, or even willing omissions in case of undercover agents[11,19,20,22,23].
One common application in graph theory is the development of random graph models that mimic the structure and behavior of real networks. Despite the current impossibility of knowing the growing mechanism of those kind of networks, the most probable at the core of the affiliation process seems to be the growth and preferential attachment ones. In this respect, the comparison between artificial model and real networks is convincing in terms of detecting the inner structure and behavior of the real network. The main problem the researchers had to face with has been the growth of available data jointly with the number of network models[24–26]; i.e., the detection and quantification of similarities (and differences) among those data.
The identification of such similarities between networks can be done by the use of distance metrics between graphs[27], even though it is a non non-trivial task. Indeed, one of the most faced issues in such regard deal with the results effectiveness, their interpretability and the computational efficiency. The validity of such techniques has indeed been assessed, being cospectrality issues one of the main reasons that could potentially make them weak. It was though shown that networks composed of 10 nodes may yield no more than 21% of cospectral graphs. This percentage decreases when graphs are composed with 11 nodes[28]. Therefore We may safely assume that cospectrality becomes negligible for larger graphs. Granted the reliability of such techniques to quantify graphs distances, the simplest and effective metrics were chosen for this work.
There is plenty of literature on this topic, in particular two reviews are available1[29–31]. Hartle et al.[32] proposed simple ensembles of random networks as benchmarks for comparing network methods and to show that the expected distance (i.e., difference/non-similarity) between networks independently sampled from a generative model can be a useful property that catch most of the main characteristics of the models. The authors calculated the within-ensemble graph distance and related quantities for classic network models using 20 distance measures commonly used to compare graphs. Another interesting work is the one conducted by Wills and Meyer[33]. It was a comparison among the most-commonly used graph and distance metrics, from which emerged their capability to discern between common topological features found in both artificial and real-world networks. They proposed multi-scale picture of graph structure from which they analyzed the effect of bot global and local structures in changes in distance metrics. The amount of useful graph comparison techniques[34] significantly reduces when one requires an algorithm which runs in reasonable time on large graphs.
To the best of authors' knowledge, there is no previous research aiming at identifying the best measures for distance between graphs in a criminal scenario. The novelty of this work consists in generating artificial networks which mirror the topology and functionality of real criminal networks; our study help us understand which artificial model best simulates real criminal networks and it concretely aids police forces to predict the formation of links between criminals as well as to detect the individuals who, if arrested, would damage the most the information flow across the organization.
To this end, the distance techniques adopted in this work are the ones proposed by Wills and Meyer[33]. Data was first generated using the most popular artificial network models like random networks (i.e., the Erdös-Rényi model), small-world networks (i.e., the Watts-Strogatz[35] model), and different configurations of scale-free networks (i.e., the Barabási-Albert[36] model). Such models were then compared with a real criminal network dataset named Meetings. Such dataset, employed in our earlier works as well[11,14,18], is publicly available on Zenodo[37]. This network describes the physical meetings among suspects in a police investigation called Montagna Operation. The investigation was concluded in 2007 by the Messina Prosecutor Office and data made available for study. Messina is the largest city in the Italian island of Sicily surface-wise and the third one for the number of inhabitans.
Our experiments identify the Barabási-Albert model as the one which better represents a criminal network. For this reason, we could expect that new members of a criminal organization will be more likely to establish connections with high degree nodes rather than low degree nodes. Such studies could indeed help LEAs in their investigations because they could focus their resources and attention on high degree individuals to intercept criminals instead to waste time and resources to follow individuals without obtaining any concrete results.
2. Methods
In this section, we explain the definitions adopted in this paper, describe the real dataset used to compare the artificial networks, and the methods we adopted to carry out the experiments.
2.1. Basic definitions
In this paper we deal with a criminal organization represented as an unweighted and unoriented graph. An unweighted graph G = ⟨N,E⟩ consists of a finite set N of n nodes and a set E ⊆ N × N of e edges. A graph is unoriented if the edge (i, j), connecting nodes i and j cannot be distinguished from the edge (j,i).
The distance between two nodes in a graph is expressed as path length, i.e., the number of edges traversed to connect two nodes. The shortest path between nodes i and j, i.e., their distance δ(ij), is the path with the fewest number of edges between them. In particular, in an undirected graph δ(ij) = δ(ji). Moreover, the length of the longest shortest path between any two nodes is called the diameter of the graph.
The adjacency matrix of a graph G is a n × n square matrix whose generic element aij is defined as
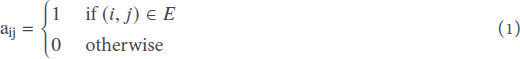
For an unoriented graph, we have aij=a ij, namely its adjacency matrix is symmetric.
The degree matrix D of a graph G is a diagonal matrix where
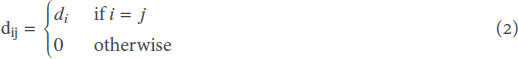
di is the degree of the ith node, namely the number of incident edges.
Given a graph, its spectrum is defined as the set of eigenvalues (sorted in increasing or decreasing order) of one of its representation matrices. It is used to characterize graph properties and extract information from its structure. In the case of the adjacency matrix A, if λk is its kth eigenvalue, the eigenvalues sorted in descending order λ1 ≥ λ2 ≥ ··· ≥ λn compose the spectrum.
2.2. Graph distances
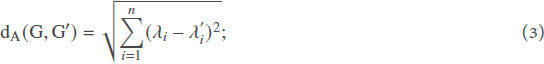
The spectral distance between two graphs G and G' having the same number n of nodes is defined as the Euclidean distance existing between their spectra (in a given representation matrix). For example, the Adjacency Spectral Distance reads
If the two graphs differ in the number of nodes, the spectra will have different sizes. To properly compute the spectral distances, some isolated nodes are added to the smaller graph so to have an equal number of nodes in the two graphs. This implies adding zero values to its spectrum. In such case, only the first meaningful eigenvalues are compared, which for the Adjacency Spectral Distance dA are the largest s eigenvalues.
The distance between two graphs can be computed using the matrix distance[33]. For each graph is first created a matrix of pairwise distances δ(i, j). The distance between the two matrices (reflecting the distance between the two graphs) is then computed using of the many available norms. In this work we adopt the DeltaCon distance.
After creating the matrix of pairwise distances δ(i, j) between the nodes of a graph

The matrix distance between the two graphs can be computed as

with ||.|| being a norm free to be chosen. If the adjacency matrix ? is adopted, the resulting distance is called edit distance.
We adopted the root euclidean distance (also known as Matsusita difference), which adopts the fast belief propagation matrix
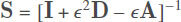
Here, I, D and A represent the the identity matrix, the degree matrix, and the adjacency matrix, respectively. ε = 1/(1 + maxi dii)[38]. The similarity DeltaCon between two graphs G and G' can be defined as

where
The root euclidean distance is quite sensitive to even small changes occurring in the graphs and is therefore preferable to the classical euclidean distance. If we assume that ε ≪ 1, S can then be expressed as a matrix power series as

2.3. Network models
Random networks try to reproduce the features of real networks by creating and populating random graphs. Among the most extensively used random network models[39] there are Erdös-Rényi (ER), Watts-Strogatz (WS), Barabási–Albert (BA) and Extended Barabási–Albert (EBA).
An ER model network[40] can be created first considering n isolated nodes and a probability value p. Then each of the n(n – 1)/2 pairs of nodes is selected and a random number in the interval [0, 1] is generated. If the generated number does not exceed p, then the selected nodes are connected. Otherwise they are left disconnected. This model, also known as the G(n,p) model[41], is completely equivalent to the so-called G(n, e) model, in which n nodes are connected with e randomly placed links.The latter is the model we used in our experiments. Real networks, and in particular real social networks, are not created like random networks and, most importantly, do not behave accordingly. Nevertheless these models can reproduce a number of different properties of real networks[40].
The WS model[35] is a variant of the ER model exhibiting small-world properties, namely graphs with large clustering coefficient and short path lengths. Most nodes can be reached from every other one by traversing a small number of edges. Such property is called Six Degree of Separation[35].
It has been shown that in a small-world network, the following property holds:

In which L is the distance between two nodes (expressed as the number of edges) and n is the number of nodes.
To build a WS model network n nodes are placed along a closed ring, each node being initially connected only to its closest two neighbors on the ring. Then, with probability p, each link is rewired to a node chosen at random. It follows that for small values of p the network exhibits large values of the clustering coefficient and, at the same time, the random long-range links have the important effect of reducing distances between nodes[35].
In the BA model[36] two mechanisms are used: i) the growth, a dynamic process during which nodes are added one by one until the final population value n is attained and, ii) the preferential attachment, according to which newly arrived nodes prefer to establish connections with well connected nodes. The combination of these two mechanisms produces a scale-free network, i.e. the degree distribution follows a power-law behavior. To build a BA model network an initial seed of m0 nodes is first considered, with the only condition that no isolated nodes are allowed. Then the growth begins, during which nodes are added one by one and connected to existing nodes. Each node has a probability depending on its degree:

New nodes tend to connect to well connected nodes. Therefore, early-comer nodes tend to increase their connections in a rich-gets-richer mechanism which can finally produce the so-called hubs, namely nodes with an abnormal number of incident edges[36].
The EBA model[42] is an extension of the standard BA model in which creation of nodes and edges and/or rewiring of edges can take place after the creation of the network according to the mechanism described above. Having defined two probabilities p and q under the condition p + q < 1, we may have that
With p probability, m new edges are added to the graph. The two ends of the m edges are selected as follows: a node is chosen at random, while the other is picked according to the preferential attachment mechanism;
With q probability, m existing edges are rewired. After having chosen at random one edge, one of the two ends is rewired to another node picked according to the preferential attachment mechanism;
With (1 – p – q) probability, m new nodes are added to the graph. The edges connecting these nodes to the "old" nodes are picked according the preferential attachment mechanism.
When p = q = 0, the EBA model reduces to the standard BA model.
2.4. Criminal network data
Criminal networks are the result of large number of different pieces of information. In particular are usually used physical and/or audio surveillance stakeouts, documents from criminal prosecutions[5], law enforcement agencies accounts[43], interviews with suspects and case studies describing the operation of secret organizations [44]. The elements of a criminal networks are the individuals appearing in the records, after a judicious screening removed those not involved in criminal activities (e.g., family, friends, legitimate business partners and suppliers)[45]. Communications, meetings, financial transactions and trading of illicit goods are modeled using edges[45].
Access to criminal organizations data is difficult, in particular records from wiretapping activities[22], and this may explain why most studies in this sector rely on a limited number of case studies involving only one source of information. Criminal networks are covert and most of the information is not publicly available. This leads to small datasets available for analysis and, most importantly, severely limits the range of applicability of the findings[46].
The dataset we use in this paper can be downloaded from Zenodo[37] and has been presented and discussed in other papers[11,14,18]. We created it starting from the pre-trial detention order issued by the Preliminary Investigation Judge of the Court of Messina on March 14, 2007 after the end of the Montagna Operation concluded in 2007 by the Public Prosecutor Office of Messina and conducted by the Special Operations Unit of the Italian Police. Two crime families, known as Mistretta and Batanesi, have been focused on in this operation. It turned out that from 2003 to 2007 they have infiltrated several economic activities leveraging on a cartel of complicit entrepreneurs to affect major infrastructural works.
We used the meeting and wiretaps described in the pre-trial detention order to create two networks. In particular, in this work we describe the results obtained from the Meetings networks which describes the meetings emerging from the police physical surveillance. The resulting network is composed of 101 nodes and 256 edges (see Figure 1). Nodes are the suspected criminals and edges are the meetings among them.
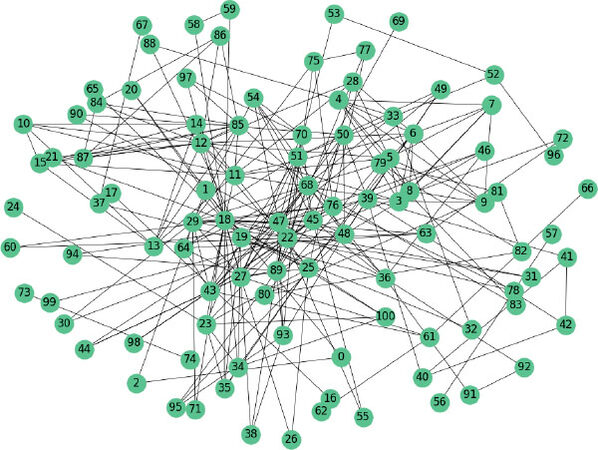
Figure 1. The Meetings criminal network.
As mentioned in[14], we have chosen the pre-trial detention order associated with the Montagna Operation because of the large number of wiretaps and stakeout instances. To the best of our knowledge, the Montagna datasets contain are the largest among all court orders we had access to. In other studies, criminal networks usually contain a smaller number of nodes[17,47,48]. We also point out that the data collection phase is very long and, in a large number of practical cases, investigation take many years. We conclude that the time variable has a different meaning in criminal networks than in other types of social networks (e.g, Facebook) in which the morphology change very quickly following exceptional events (e.g., sporting or political events). Criminal networks are much more stable over time because criminal organizations display a strong level of organization and their structure slowly change over time: for instance, the recruitment of new members take a long amount of time and strong trust relationships between new members and individuals who already belong to the criminal organization.
2.5. Experimental design
In this paper we want to measure how well an artificial network may catch some real network features, in this case in a criminal scenario. For this reason we first computed the simDC similarity and the drootED distance (see Equation (6) and Equation (7)).
Thus, we have compared the Meetings criminal network with three network models, i.e., ER, WS and BA with several configurations, for a total of 5 models. The analysis of this network conducted in a previous study[18] found that it followed a scale-free power law. For this reason, we have chosen the BA model.
Even if this is not the main purpose of our study, it is worth highlighting that criminal organizations adopt specific criteria for recruiting new affiliates (growing and preferential attachment dynamics)[49]. A single network snapshot such as the Montagna Meetings network we created is clearly insufficient, as a temporal network would be better suited. But this would require a deeper knowledge of the dynamics of the criminal network which is usually unknown. For comparison, we have selected also the ER and WS models, notwithstanding the fact that the random nature of these models hardly can reproduce the nature of a real network. The WS model is more realistic than the ER model because it exhibits a small diameter, short average path lengths and high clustering coefficient. In most real networks, in fact, nodes tend to create close groups with a high density of edges. Despite this, WS models cannot model real networks where degree distributions are usually power-law as in the BA models.
We used Python and NetworkX[50] to create all the model networks. In Table Table 1 are listed the parameters and the corresponding values used in our experiments. The number of nodes n is defined a priori in all the models considered, whereas the number of edges e is set only in the ER model. In WS, k represents the number of nearest neighbors in ring topology to which each node is connected. We chose k = 6 so to obtain a nummber of edges as close as possible to the real criminal network. The same has been done for the input parameters of all the BA models chosen herein. But, in this case, three different configurations have been selected: BA2, BA3 and EBA. BA2 and BA3 are standard BA models in which each new node is connected to m = 2 and m = 3 "old" nodes respectively. The EBA model requires two more parameters: i) p, representing the probability that m randomly chosen pairs of nodes are connected by and edge and, ii) q, the probability of rewiring an edge. We set q = 0 to avoid introducing more randomness in the network.process.
Network models parameters
| Network model | Parameter | |||||
|---|---|---|---|---|---|---|
| n | e | m | k | p | q | |
| ER | 101 | 256 | ||||
| WS | 101 | 6 | 0.6 | |||
| BA2 | 101 | 2 | ||||
| BA3 | 101 | 3 | ||||
| EBA | 101 | 2 | 0.225 | 0 | ||
Then, we computed the DeltaCon similarity, which allows to compare two graphs having different numbers of nodes and/or edges. Unfortunately this measure did not yielded indisputable results about the model network closest to the real network. We therefore resorted to compute the adjacency spectral distance which, in contrast, clearly allowed us to identified the BA model networks as the best at catching the real network features.
The last step consisted in considering the number of edges of the model networks. The BA model networks with m = 2 and m = 3 have a number of edges different from the real network. For this reason we decided to further investigate whether the adjacency spectral distance could have been reduced by increasing (in the case of BA2) or reducing (BA3) the number of edges until they were equal to the number of edges of the real network. This is required to iteratively add an edge to the BA2 (respectively remove an edge from the BA3) and recalculate the adjacency spectral distance. The procedure ends when the number of edges coincides with that of the real network. Two strategies have been devised to select the candidate edge: i) a preferential attachment selection, in which the edge is added (or removed) among the edges of the best connected nodes and, ii) a random selection, in which the edge is selected at random.
In order to significantly reduce statistical errors, the experiments have been repeated 1000 times for each artificial network (ER, WS, BA2, BA3, EBA), from which the average values have been computed.
3. Results
In this section, the results of our comparative investigation between the real criminal network and the artificial models are described.
The analysis starts with the computations of the root euclidean distance drootED and the DeltaCon similarity simDC between the real network and the five random models. To carry a statistical analysis, the final results shown in Table 2 are the average of 100 tests performed for each random model. Being drootED a distance measure, the higher its value is, the more the two compared networks are different. Viceversa, being simDC a similarity measure that takes values between 0 and 1, the more its value is close to 1, the more the two compared networks are similar.
Root euclidean distance drootED and DeltaCon similarity simDC between the Meetings network and the artificial models
| Network model | e | drootED | simDC |
|---|---|---|---|
| ER | 256 | 2.2 ± 0.2 | 0.317 |
| WS | 202 | 2.5 ± 0.2 | 0.287 |
| EBA | 246 | 1.31 ± 0.08 | 0.433 |
| BA2 | 198 | 1.28 ± 0.08 | 0.438 |
| BA3 | 294 | 1.27 ± 0.07 | 0.441 |
The results show the ER and WS models being the most distant from the real network. All the three BA models show indeed a greater similarity and with very similar results, with BA3 being the most performing between them. However, there is not a random model that stands out the most among them all. This could be caused by such metrics to be insufficient on their own in case of a criminal network topology. A further investigation could be performed by analyzing the similarity between the random models themselves, but such approach at the moment lies outside the scopes of this work. For these reasons, the similarities between the real network and the random models were further analyzed by evaluating the adjacency spectral distance dA. These results are shown in Table 3.
Adjacency Spectral Distance dA between the Meetings network and the artificial models
| Network model | e | dA |
|---|---|---|
| ER | 256 | 8.4 ± 0.2 |
| WS | 303 | 9.2 ± 0.2 |
| EBA | 255 | 6.6 ± 0.2 |
| BA2 | 198 | 6.9 ± 0.2 |
| BA3 | 294 | 7.1 ± 0.2 |
The adjacency spectral distance dA confirms the ER and WS models to be the most distant from the real network and the three BA models to be the most similar. Since the latter results are still similar at the point of not having one of the three outperforming the others, some adjustments were performed as described in Section 2.5. Experimental design. Being the number of edges smaller in case of the models BA2 and higher in case of the models BA3, two procedures were adopted to iteratively add (in the first case) or remove (in the second case) edges until the same number of edges of the real network (256) is reached. The two procedures are respectively based on a preferential attachment approach and a totally random selection approach. Figure 2 shows how the adjacency spectral distance dA varies as the edges increase (in the case of the BA2 models, full line), or decrease (in the case of the BA3 models, dashed line), for both the preferential attachment approach (plot above) and the random approach (plot below). The plots show how the adjustment of the number of edges reduces the distance. In particular, the preferential attachment selection works best for the BA2 models and the random selection works best for the BA3 models, with comparable results for both.
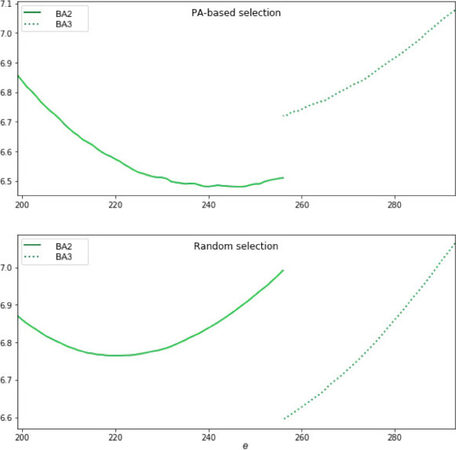
Figure 2. Adjacency Spectral Distance dA as a function of the number of edges (added or deleted). Upper subplot: in case of the preferential attachment-based selection of edges; Lower subplot: in case of random selection of edges.
In Figure 3 and Figure 4 are shown a graphical comparison between the Meetings network and the BA models. The five high degree nodes are highlighted because, as already mentioned in Section, the identification of the most important nodes in an artificial model could lead to also find the key nodes in criminal network thus helping in police investigations.
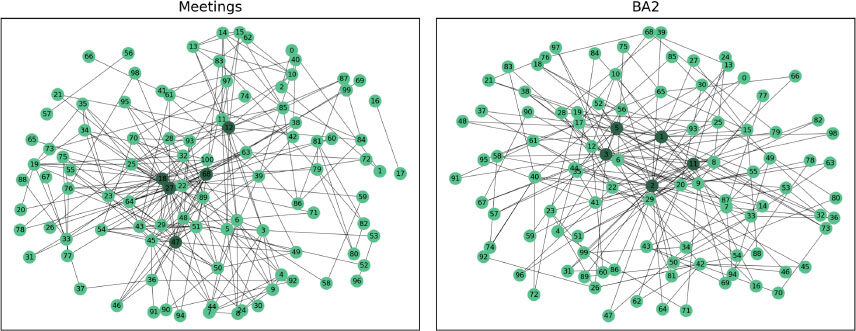
Figure 3. Graphical comparison between the Meetings network and the BA2 model.
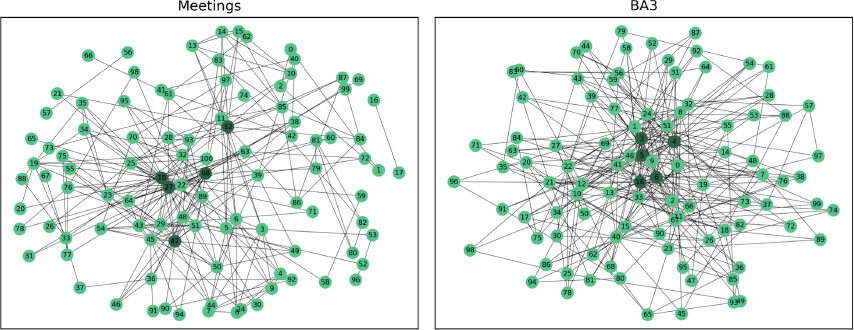
Figure 4. Graphical comparison between the Meetings network and the BA3 model.
4. Conclusions
In this paper, we used traditional network models from graph theory (i.e., ER, WS, BA and EBA) to replicate the topology of a real criminal network representing the suspected criminals co-participation in meetings. It draws from a case study on a large law enforcement operation (i.e., the Montagna operation) tackling the Sicilian Mafia, a criminal organization which operates especially in the south of Italy.
To find the best model which reproduced the criminal network, we computed two graph distances, i.e., the Root Euclidean Distance and Adjacency Spectral Distance. The first distance does not depend on the graph size and for this reason it can only be used to identify the model to be discarded. Even using the second distance we did not obtain particularly relevant results because there were small differences between the various models.
Therefore, we decided to change the number of edges in the network models to obtain a model as close as possible to the real criminal network. To make this change, we followed a particular strategy which consisted in the addition or removal of some edges. The preferential attachment and detachment processes were used to add edges to high degree nodes or to remove edges from them. Then, a randomly chosen number of edges was added or removed.
Based on our preliminary results, the BA model can be identified as the closest model to a real criminal network. This study has limitations which may be addressed by future research. First, our results rely on a single case study, which implies limited external validity. Our analysis focused on the Sicilian Mafia which has a very peculiar hierarchical structure[51]. Its peculiarities may hinder the generalizability of our results to other form of organized crime. For this reason, we should test our method on different kinds of dark networks such as terrorist, drug trafficking or street gangs networks. Unfortunately, most of the information about dark networks is not publicly available and this leads to small datasets available for analysis.
Our research can pave the way to the application of network models in police investigations. LEAs could create models which replicate criminal networks starting from the investigation data, even if they are affected by noise or missing information. Network models could be used to predict and prevent the creation of relationship ties between criminals or to break those ties by arresting one or more of the suspects.
Declarations
Authors’ contributionsMade substantial contributions to conception and design of the study and performed data analysis and interpretation: Ficara A, Curreri F, Cavallaro L
Performed data acquisition, as well as provided administrative, technical, and material support: De Meo P, Fiumara G, Bagdasar O, Liotta A
Availability of data and materialsData are available on Zenodo[37].
Financial support and sponsorshipNone.
Conflicts of interestAll authors declared that there are no conflicts of interest.
Ethical approval and consent to participateNot applicable.
Consent for publicationNot applicable.
Copyright© The Author(s) 2021.
REFERENCES
1. Finckenauer JO. Problems of definition: What is organized crime? Trends in Organized Crime 2005;8:63-83.
2. Thrasher FM. The gang: A study of 1,313 gangs in Chicago. University of Chicago Press; 2013.
3. Adler PA. Wheeling and dealing: An ethnography of an upper-level drug dealing and smuggling community. Columbia University Press; 1993.
4. Reuter P. Disorganized crime: The economics of the visible hand. MA: MIT press Cambridge; 1983.
5. Morselli C. .
6. Gambetta D. The Sicilian Mafia: The Business of Private Protection. Cambridge: Harvard University Press; 1996.
7. Paoli L. Mafia brotherhoods: Organized crime, Italian style. Oxford Scholarship Online: Oxford University Press; 2008.
8. Campana P. Explaining criminal networks: Strategies and potential pitfalls. Methodological Innovations 2016;9:205979911562274.
9. Kleemans ER, de Poot CJ. Criminal Careers in Organized Crime and Social Opportunity Structure. European Journal of Criminology 2008;5:69-98.
10. Hulst R. Introduction to Social Network Analysis (SNA) as an investigative tool. Trends in Organized Crime 2008;12:101-21.
11. Calderoni F, Catanese S, De Meo P, Ficara A, Fiumara G. Robust link prediction in criminal networks: A case study of the Sicilian Mafia. Expert Systems with Applications 2020;161:113666.
12. Johnsen JW, Franke K. Identifying Central Individuals in Organised Criminal Groups and Underground Marketplaces. In: Shi Y, Fu H, Tian Y, Krzhizhanovskaya VV, Lees MH, editors. Computational Science – ICCS 2018. Cham: Springer International Publishing; 2018. pp. 379-86.
13. Duijn PAC, Kashirin V, Sloot PMA. The Relative Ineffectiveness of Criminal Network Disruption. Scientific Reports 2014;4:4238.
14. Cavallaro L, Ficara A, De Meo P, Fiumara G, Catanese S, et al. Disrupting resilient criminal networks through data analysis: The case of Sicilian Mafia. PLOS ONE 2020;15:e0236476.
15. Rostami A, Mondani H. The Complexity of Crime Network Data: A Case Study of Its Consequences for Crime Control and the Study of Networks. PLOS ONE 2015;10:1-20.
16. Robinson D, Scogings C. The detection of criminal groups in real-world fused data: using the graph-mining algorithm "GraphExtract". Security Informatics 2018;7:2.
17. Villani S, Mosca M, Castiello M. A virtuous combination of structural and skill analysis to defeat organized crime. SocioEconomic Planning Sciences 2019;65:51-65.
18. Ficara A, Cavallaro L, De Meo P, Fiumara G, Catanese S., et al. Social Network Analysis of Sicilian Mafia Interconnections. Complex Networks and Their Applications, VIII. Springer International Publishing; 2020. pp. 440-50.
19. Ferrara E, De Meo P, Catanese S, Fiumara G. Detecting criminal organizations in mobile phone networks. Expert Systems with Applica tions 2014;41:5733-50.
20. Agreste S, Catanese S, De Meo P, Ferrara E, Fiumara G. Network structure and resilience of Mafia syndicates. Information Sciences 2016;351:30-47.
21. Rothenberg R. From whole cloth: Making up the terrorist network. Connections 2002;24:36-42.
22. Berlusconi G, Calderoni F, Parolini N, Verani M, Piccardi C. Link Prediction in Criminal Networks: A Tool for Criminal Intelligence Analysis. PLOS ONE 2016;11:1-21.
23. De Moor S, Vandeviver C, Vander Beken T. Assessing the missing data problem in criminal network analysis using forensic DNA data. Social Networks 2020;61:99-106.
24. Squartini T, Mastrandrea R, Garlaschelli D. Unbiased sampling of network ensembles. New Journal of Physics 2015;17:023052.
25. Peixoto TP. Reconstructing Networks with Unknown and Heterogeneous Errors. Phys Rev X 2018;8:041011.
26. Newman MEJ. Estimating network structure from unreliable measurements. Phys Rev E 2018;98:062321.
27. Tantardini M, Ieva F, Tajoli L, Piccardi C. Comparing methods for comparing networks. Scientific Reports 2019;9:17557.
28. Wilson RC, Zhu P. A study of graph spectra for comparing graphs and trees. Pattern Recognition 2008;41:2833-41.
29. Soundarajan S, Eliassi-Rad T, Gallagher B. .
30. Emmert-Streib F, Dehmer M, Shi Y. Fifty years of graph matching, network alignment and network comparison. Information Sciences 2016;346-347:180-97.
31. Donnat C, Holmes S. Tracking network dynamics: A survey using graph distances. The Annals of Applied Statistics 2018;12:971-1012.
32. Hartle H, Klein B, McCabe S, et al. Network comparison and the within-ensemble graph distance. Proceedings of the Royal Society A: Mathematical, Physical and Engineering Sciences 2020 11 ;476:20190744.
33. Wills P, Meyer FG. Metrics for graph comparison: A practitioner's guide. PLOS ONE 2020;15:e0228728.
34. Akoglu L, Tong H, Koutra D. Graph based anomaly detection and description: a survey. Data Mining and Knowledge Discovery 2015;29:626-88.
37. Cavallaro L, Ficara A, De Meo P, et al. Criminal Network: The Sicilian Mafia. "Montagna Operation". Zenodo 2020; doi: 10.5281/zenodo.3938818.
38. Koutra D, Vogelstein JT, Faloutsos C. DELTACON: A Principled Massive-Graph Similarity Function.. , ;.
39. Ficara A, Fiumara G, De Meo P, Liotta A. Correlations Among Game of Thieves and Other Centrality Measures in Complex Networks. In: Fortino G, Liotta A, Gravina R, Longheu A, editors. Data Science and Internet of Things: Research and Applications at the Intersection of DS and IoT. Cham: Springer International Publishing; 2021. pp. 43-62.
40. Erdös P, Rényi A. On Random Graphs I. Publicationes Mathematicae 1959;6:290-97.
42. Albert R, Barabási AL. Topology of Evolving Networks: Local Events and Universality. Phys Rev Lett 2000;85:5234-37.
43. Malm A, Bichler G. Networks of Collaborating Criminals: Assessing the Structural Vulnerability of Drug Markets. Journal of Research in Crime and Delinquency 2011;48:271-97.
45. Faust K, Tita GE. Social Networks and Crime: Pitfalls and Promises for Advancing the Field. Annual Review of Criminology 2019;2:99-122.
46. Jupp VR. Methods of Criminological Research. Taylor & Francis; 2012.
47. Grund TU, Densley JA. Ethnic Homophily and Triad Closure: Mapping Internal Gang Structure Using Exponential Random Graph Models. Journal of Contemporary Criminal Justice 2015;31:354-70.
48. Natarajan M. Understanding the Structure of a Large Heroin Distribution Network: A Quantitative Analysis of Qualitative Data. Journal of Quantitative Criminology 2006;22:171-92.
49. Williams P. Transnational criminal networks. Networks and netwars: the future of terror, crime, and militancy 2001;1382:61.
50. Hagberg AA, Schult DA, Swart PJ. Exploring Network Structure, Dynamics, and Function using NetworkX.. , ;.
51. Ficara A, Fiumara G, De Meo P, Catanese S. Multilayer Network Analysis: The Identification of Key Actors in a Sicilian Mafia Operation. In: Perakovic D, Knapcikova L, editors. Future Access Enablers for Ubiquitous and Intelligent Infrastructures. Cham: Springer International Publishing; 2021. pp. 120-34.
Cite This Article
Export citation file: BibTeX | RIS
OAE Style
Ficara A, Curreri F, Cavallaro L, De Meo P, Fiumara G, Bagdasar O, Liotta A. Social network analysis: the use of graph distances to compare artificial and criminal networks. J Smart Environ Green Comput 2021;1:159-72. http://dx.doi.org/10.20517/jsegc.2021.08
AMA Style
Ficara A, Curreri F, Cavallaro L, De Meo P, Fiumara G, Bagdasar O, Liotta A. Social network analysis: the use of graph distances to compare artificial and criminal networks. Journal of Smart Environments and Green Computing. 2021; 1(3): 159-72. http://dx.doi.org/10.20517/jsegc.2021.08
Chicago/Turabian Style
Ficara, Annamaria, Francesco Curreri, Lucia Cavallaro, Pasquale De Meo, Giacomo Fiumara, Ovidiu Bagdasar, Antonio Liotta. 2021. "Social network analysis: the use of graph distances to compare artificial and criminal networks" Journal of Smart Environments and Green Computing. 1, no.3: 159-72. http://dx.doi.org/10.20517/jsegc.2021.08
ACS Style
Ficara, A.; Curreri F.; Cavallaro L.; De Meo P.; Fiumara G.; Bagdasar O.; Liotta A. Social network analysis: the use of graph distances to compare artificial and criminal networks. . J. Smart. Environ. Green. Comput. 2021, 1, 159-72. http://dx.doi.org/10.20517/jsegc.2021.08
About This Article
Copyright

Data & Comments
Data


 Cite This Article 21 clicks

 Like This Article 31
likes
Like This Article 31
likes


Comments
Comments must be written in English. Spam, offensive content, impersonation, and private information will not be permitted. If any comment is reported and identified as inappropriate content by OAE staff, the comment will be removed without notice. If you have any queries or need any help, please contact us at support@oaepublish.com.